Introduction
One morning a CronJob in my homelab had failed. Not crashed: failed without ever starting. The Job status said this and nothing else:
Job was active longer than specified deadlineNo container logs, because no container had run. The pod had sat in Pending for 90 minutes until the Job’s activeDeadlineSeconds killed it. The previous night, the same job had finished in 47 seconds.
The rule behind it is well known, and I knew it: Kubernetes never moves a running pod. My cluster simply had nothing in place to undo what drains leave behind. In two days, every node had been drained twice: first for a Kubernetes upgrade, then to give the VMs more RAM. After that, the pods were not where the scheduler would have put them on a fresh cluster. They were wherever the last drain had pushed them. One node had 97 % of its CPU reserved, another had 29 %.
This post is the follow-up to my PDB drain story. That one was about getting pods off a node. This one is about what happens after: the lopsided cluster a rolling drain leaves behind, and how I set up descheduler to rebalance it every night. That includes the mistakes I made on the first run.
Three Concepts Before the Story
The drain vocabulary (cordon, drain, eviction) is covered in the previous post. Three more ideas carry this one:
Scheduling happens once. The kube-scheduler picks a node for a pod when the pod is created. After that it never looks at the pod again. If the cluster changes (a node reboots, a new node joins, another node empties), running pods stay where they are. The only way a pod “moves” is to be deleted and recreated, and then the scheduler makes a new decision.
The scheduler reasons on requests, not usage. Each container declares resources.requests (“I need 100m of CPU”). The scheduler adds up the requests of the pods on each node and compares them with what the node can allocate. A node can be almost idle and still count as full on paper. By default, among the nodes that fit, the scheduler prefers the one with the lowest requested percentage (the LeastAllocated scoring strategy).
QoS classes. Kubernetes puts every pod into a class based on its requests and limits:
- Guaranteed: requests equal limits for every container.
- Burstable: some requests are set.
- BestEffort: no requests or limits at all.
BestEffort pods reserve nothing, so they are the first to go under memory pressure. That detail comes back later.
The Investigation
The failed CronJob rewrites ratings in my media server’s database. Its pod mounts the same ReadWriteOnce volume as the media server, so it must run on the same node. That is a required pod affinity:
affinity:
  podAffinity:
    requiredDuringSchedulingIgnoredDuringExecution:
      - labelSelector:
          matchLabels: { app: plex }
        topologyKey: kubernetes.io/hostname
kubectl describe job showed Events: <none>. Kubernetes keeps events for one hour by default, and the job had failed 17 hours earlier. Luckily my log pipeline ships cluster events to VictoriaLogs, where the answer was waiting:
0/5 nodes are available: 1 Insufficient cpu,
4 node(s) didn't match pod affinity rules.
Four nodes were ruled out by the affinity. The fifth, the only one allowed, had no CPU left to reserve:
| Node | CPU requested | Memory requested |
|---|---|---|
| node 1 | 97 % (1892m / 1950m) | 48 % |
| node 2 | 86 % | 43 % |
| node 3 | 58 % | 31 % |
| node 4 | 53 % | 31 % |
| node 5 | 29 % | 15 % |
The job asked for 100m. Node 1 had 58m free. The scheduler was right, and it kept being right for 90 minutes.
The media server itself is not free to go anywhere either. Its pod requests an extended resource, gpu.intel.com/i915: 1, published by the Intel GPU device plugin. Each node passes its integrated GPU through to its VM: one GPU per node, which cannot be shared. On top of that, a preferred node affinity steers the media server towards the four nodes with the same GPU generation. So the constraints chain together:
- The GPU request and the GPU preference choose the media server’s node.
- The shared volume forces the job onto that same node.
- The job then needs CPU on a node that nobody picked for its free CPU.
How a Rolling Drain Skews a Cluster
My first suspect was the Kubernetes upgrade, the most recent big change. The node events in my log store tell a more precise story, with two rolling drains:
| When | What happened | Job that night |
|---|---|---|
| Day 1 | Kubernetes patch upgrade, followed by a rolling reboot: cordon, drain and reboot, one node at a time | Finished in 47 s |
| Day 2 | RAM upgrade: each VM drained, resized and rebooted, about two minutes per node | Stuck Pending, then killed |
Apart from the DaemonSets, every pod on node 1 had been created within three minutes on day 2, right after node 1 came back from its RAM upgrade. Both rollings drained every node. The first one happened to leave room on the media server’s node, the second one did not. That is the uncomfortable part: the final layout depends on the order and the timing of the drains, so the same maintenance can be harmless one day and break a job the next.
A rolling drain goes like this:
- Node 1 is drained. Its pods move to nodes 2 to 5. Node 1 reboots and comes back empty.
- Node 2 is drained. Its pods need a new home, and node 1 is now the emptiest node, so
LeastAllocatedsends most of them there. - Nodes 3 and 4 follow the same pattern. Node 1 keeps collecting.
- Node 5 is drained last. Its pods leave, it comes back empty, and nothing ever moves back, because there is no drain left to trigger a new decision.
Each individual placement was sensible. The result was a cluster where the first node back absorbed everything and the last node back stayed nearly empty. Nothing was broken, so no alert fired. It only surfaced when a pod with a strict placement rule needed room on the one node that had none.
The Quick Fix
The container has no CPU limit, so its CPU request does only one thing: it drives placement. The job runs for under a minute. I dropped the request from 100m to 10m and re-ran the job by hand. It was scheduled at once and finished in 17 seconds.
That fixed the job, not the cluster. The next drain would pile things up again.
Enter descheduler
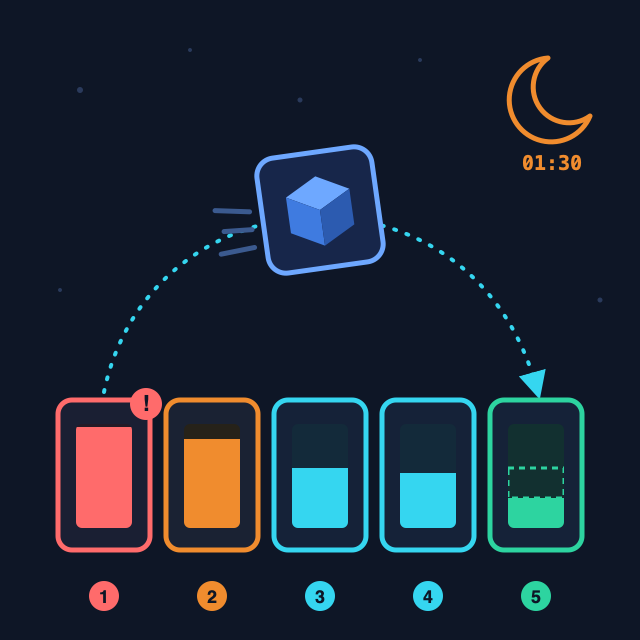
descheduler is the official SIG Scheduling project for this exact gap. It does the opposite of the scheduler: it looks at pods that are already running, finds the ones that are badly placed according to a policy, and evicts them. It never places anything itself. The evicted pod’s controller (a ReplicaSet, a StatefulSet) creates a replacement, and the regular scheduler places it with fresh information.
graph TD
    A[node above 80%] -->|descheduler evicts| B[pod removed]
    B -->|controller recreates| C[pending pod]
    C -->|kube-scheduler scores| D[node below 50%]

    style A fill:#ff6b6b,stroke:#c0392b,color:#fff
    style D fill:#35d6f0,stroke:#1a8fa3,color:#101c40
It uses the Eviction API, the same one kubectl drain uses, so PodDisruptionBudgets are respected. It skips DaemonSet pods, static pods, system-critical pods and pods with no controller unless you tell it otherwise.
descheduler ships many strategies (duplicate pods, broken affinities, topology spread, pods restarting too often…). For a lopsided cluster, the relevant one is LowNodeUtilization.
How LowNodeUtilization Decides
You give it two sets of percentages, computed on requests, like the scheduler:
thresholds: a node below these values for every listed resource is underutilized. It can receive pods.targetThresholds: a node above these values for any listed resource is overutilized. It gives pods away.
Nodes in between are left alone. Pods are evicted from overutilized nodes until they drop below the target, or until the underutilized nodes have no room left up to the target. If there is no underutilized node at all, nothing happens. That last rule matters later.
My Policy
descheduler runs as a Helm release managed by Flux. The chart can deploy it as a Deployment (a loop) or a CronJob. I picked a nightly CronJob: drains are rare events, and I would rather have evictions happen at night than at a random moment during the day.
values:
  kind: CronJob
  schedule: "30 1 * * *"
  timeZone: Europe/Brussels
  # The chart asks for 500m of CPU. That would not fit on the busy node
  # the run is supposed to relieve. A run lasts a few seconds.
  resources:
    requests: { cpu: 20m, memory: 64Mi }
    limits: { cpu: null, memory: 256Mi }
  deschedulerPolicy:
    maxNoOfPodsToEvictTotal: 10
    profiles:
      - name: rebalance
        pluginConfig:
          - name: DefaultEvictor
            args:
              nodeFit: true
              podProtections:
                defaultDisabled: ["PodsWithLocalStorage"]
              namespaceLabelSelector:
                matchExpressions:
                  - key: kubernetes.io/metadata.name
                    operator: NotIn
                    values: ["kube-system", "postgres"]
              labelSelector:
                matchExpressions:
                  - { key: app, operator: NotIn, values: ["plex"] }
                  - { key: batch.kubernetes.io/job-name, operator: DoesNotExist }
          - name: LowNodeUtilization
            args:
              thresholds: { cpu: 50, memory: 50 }
              targetThresholds: { cpu: 80, memory: 80 }
              evictionLimits:
                node: 5
        plugins:
          balance:
            enabled: ["LowNodeUtilization"]
The profiles list replaces the chart’s default list entirely, because Helm does not merge lists. None of the chart’s default strategies run, only the one I chose.
What Never Moves
kube-system: cluster components stay where they are.postgres: since the PDB post, my CloudNativePG cluster has two instances. Evicting the primary triggers a switchover. It is safe, but it gains nothing.- The media server (
app=plex): an eviction cuts every stream in progress. Nobody wants that, even at 01:30. - Job pods: evicting one breaks the run and frees nothing lasting, since the pod ends on its own anyway.
nodeFit: true: a pod is evicted only if another node can actually take it (requests, node affinity, taints). Evicting a pod that has nowhere to go would just create downtime.
“But My Storage Is on Ceph”
By default, descheduler refuses to evict pods that use local storage. My first reaction was that this didn’t apply to me: all my volumes are Ceph RBD, reachable from every node. That mixes up two different things:
- A PersistentVolumeClaim on Ceph is network storage. The volume is
ReadWriteOnce, so it is attached to one node at a time, but it can be detached and attached on any node. Evicting the pod costs a few seconds of detach and reattach, and no data is lost. - An
emptyDirhas nothing to do with Ceph. It is a directory that the kubelet creates on the node’s own disk (or in RAM). It is created with the pod and deleted with the pod. Evicting the pod throws its content away. That is why descheduler protects these pods by default.
So the real question was: what do my emptyDir volumes contain? I counted: 21 of my 50 non-DaemonSet pods had at least one. Every one of them held scratch data: sockets, caches, /tmp, shared memory, a transcode directory. My drain commands already use --delete-emptydir-data, which accepts exactly the same loss. So I disabled that protection (defaultDisabled: ["PodsWithLocalStorage"]). Without that, descheduler would have ignored almost half the cluster.
Note the opposite trap: the Helm chart enables PodsWithPVC protection by default, which excludes every pod with a PVC. On Ceph, that protection is pointless, so my profile leaves it out.
Rebalancing Right After a Drain
Waiting for 01:30 after planned maintenance makes no sense. My just recipes for rolling operations now end with an immediate descheduler run:
rebalance *args:
    #!/usr/bin/env bash
    set -euo pipefail
    JOB="descheduler-manual-$(date +%Y%m%d-%H%M%S)"
    kubectl -n descheduler create job "$JOB" --from=cronjob/descheduler
    # ...wait for completion, then print the node classification and evictions
just talos::rolling-restart and just talos::upgrade-all call it once the last node is back. The policy is the same as the nightly run, so the exclusions still apply.
What Went Wrong on the First Run
I planned a dry-run first. It did not go as planned.
The Dry-Run That Wasn’t
The first version of the recipe took a parameter, rebalance dry="false", and I ran:
just talos::rebalance dry=truejust has no named arguments after the recipe name. It passed the whole string dry=true as the first positional value. My recipe compared that with true, the comparison failed, and it ran a real descheduler pass at 7 pm. Eight pods were evicted: Grafana, my RSS reader, one of my two tunnel connectors, a CI runner, a few operators and exporters.
No harm done: all eight were Running and Ready again within a minute. It was still not what I meant to do. The recipe now accepts no argument at all and stops if it gets one. An unknown argument should never silently turn into “run it for real”.
The Threshold That Stalled
Those eight evictions taught me more than a dry-run would have. Seven of the eight pods landed on node 5, the emptiest node, exactly as LeastAllocated predicts. Node 5 went from 29 % to 41 % of CPU requested in one run.
My first thresholds were 40 %. After this run, no node was below 40 % any more, so the next nightly runs would find no underutilized node and evict nothing. Node 1 would have stayed at 88 % forever. I raised the underutilized threshold to 50 %.
Since then I think about the gap between the two thresholds like this: evicted pods don’t spread out, they all go to the emptiest node. The “underutilized” band needs to be wide enough to survive the first batch landing on it.
BestEffort Pods Go First
Why did node 1 only drop from 97 % to 88 %? The descheduler log says it plainly:
Evicting pods based on priority, if they have same priority,
they'll be evicted based on QoS tiers
Lowest QoS first means BestEffort first, and BestEffort pods have no requests. Two of the five evictions from node 1 freed exactly zero millicores, and they still counted against my limit of five evictions per node. Convergence can take two nights. I kept the limit anyway: a slow, bounded rebalance is fine for a homelab.
A Dry-Run That Always Says “Nothing”
Then I ran a genuine dry-run (--dry-run on the container) with the new policy. Every node came out at 0 %:
"Node has been classified" category="underutilized" node="node-1"
    usage={"cpu":"0","memory":"0","pods":"0"}
...
"All nodes are underutilized, nothing to do here"
In dry-run mode, descheduler v0.36.0 builds a cached client of the cluster. On my cluster, that cache saw the nodes but none of the pods, so every run concluded there was nothing to do, whatever the real state. A dry-run that always answers “nothing to do” is worse than no dry-run, because it builds false confidence. I removed the dry-run mode from my recipe and made a note to re-test it on the next chart upgrade.
Where Evicted Pods Land
This one is not a bug, but it is worth knowing before you enable descheduler. It decides what leaves. The scheduler decides where it goes, and that is almost always the emptiest node. In my cluster, the emptiest node is also the weakest: a low-power Celeron that only supports the x86-64-v2 instruction set, while the others are v3. Any image built for v3 that has never run on that node will crash-loop there after a night run. I have hit this before with a storage driver update. Your emptiest node deserves a second look before you let a CronJob send pods to it unattended.
Watching the Watcher
A nightly job that fails quietly is exactly how this story started. So descheduler got a dead-man switch: a daily job reads the CronJob’s .status.lastSuccessfulTime through the Kubernetes API and pushes the result to a push monitor in Uptime Kuma. A run older than 26 hours pushes down. If the checking job dies too, the silence itself raises the alert after 26 hours.
What Is Still Missing: Who Is Connected?
descheduler knows requests, priorities and QoS classes. As far as I know, nothing in it, and nothing in Kubernetes, knows whether a person is using a pod right now. A PodDisruptionBudget does not help either: it counts replicas, not users.
My exclusions are static. The media server never moves, everything else may. But evicting the remote desktop gateway closes an open session, and evicting a tunnel connector drops the requests going through it. Running at 01:30 is a bet that nobody is connected, not a check.
Two ideas I have not built yet:
- A pre-flight check. Wrap the nightly run in a script that asks the apps first, for example the media server’s active streams through Tautulli, and skip the run if someone is watching. Simple, but coarse: one active stream blocks the whole rebalance.
- Dynamic annotations. descheduler honours a
descheduler.alpha.kubernetes.io/prefer-no-evictionpod annotation, andnoEvictionPolicy: Mandatoryturns it into a hard rule. A small job could add the annotation to pods with active sessions and remove it when the sessions end. More precise, but every app needs its own way to report its sessions.
Until one of those exists, the exclusion list and the 01:30 schedule do the job.
Key Takeaways
| Concept | What I Learned |
|---|---|
| Scheduling is one-shot | The scheduler never moves a running pod; after a rolling drain, the first node back absorbs everything |
| Constraints chain | A GPU request picks one pod’s node; a shared RWO volume pins another pod to it, CPU or not |
| Requests, not usage | Both the scheduler and LowNodeUtilization count requests; an idle node can be “full” |
| Events expire | Kubernetes keeps events for one hour; ship them to your log store or lose the only clue |
| emptyDir ≠ PVC | emptyDir is node-local and deleted with the pod; a Ceph PVC reattaches anywhere |
| Threshold gap | Evicted pods pile onto the emptiest node; leave room in the “underutilized” band |
| QoS order | BestEffort pods are evicted first and free nothing; convergence can take several runs |
| Test your dry-run | A dry-run that always says “nothing to do” is worse than none |
| Users are invisible | Neither descheduler nor PDBs know someone is connected; a night schedule is a bet, not a check |
Conclusion
Every component in this story did its job. The scheduler made good decisions with the information it had at the time. The drain moved pods exactly as asked. The affinity kept the job on the only node where its volume could be mounted. The gap was time: nothing in Kubernetes revisits old placement decisions, so a cluster that was balanced when it was built drifts with every maintenance.
descheduler fills that gap with very little configuration: one strategy, a few exclusions, a nightly schedule. The first run also showed that the defaults are not neutral. A 40 % threshold stalled after one batch, a dry-run could not see my pods, and evicted pods all went to the one node I would rather keep light. A night or two from now the cluster should be even again, and the next drain will clean up after itself.
Useful Resources: